
Translate this page into:
Glycemic status as a modifier of tuberculosis presentation: Evidence from a cross-sectional study

*Corresponding author: Rahul Garg, Department of Medicine, Farukh Hussain Medical College, Agra, Uttar Pradesh, India. gargrahul27@gmail.com
-
Received: ,
Accepted: ,
How to cite this article: Garg R, Prakash P. Glycemic status as a modifier of tuberculosis presentation: Evidence from a cross-sectional study. Med India. doi: 10.25259/MEDINDIA_2_2025
Abstract
Objectives
This study aims to investigate the clinical spectrum of tuberculosis (TB) in patients with diabetes mellitus (DM) and analyze its relationship with glycemic status.
Materials and Methods
A cross-sectional study of 372 patients with concurrent TB and DM was conducted at a tertiary care hospital. Glycemic control was categorized based on hemoglobin A1C levels as good (≤7%), moderate (7.1–9%), and poor (>9%). Clinical presentations, radiological findings, and laboratory parameters were analyzed.
Results
The mean age was 44.3 ± 8.7 years, with male predominance (71.2%). Pulmonary TB was predominant (65.3%), while extrapulmonary TB comprised 34.7% of cases. Sputum positivity rates increased significantly with poorer glycemic control: 42.3% in good control versus 76.2% in poor control (P < 0.001). Poor glycemic control was associated with higher rates of lower zone involvement (67.9%), bilateral disease (58.4%), and cavity formation (45.3%). Among extrapulmonary manifestations in poorly controlled patients, disseminated TB (45.5%) and lymph node TB (28.0%) were most common.
Conclusion
Poor glycemic control is associated with higher sputum positivity, atypical radiological presentations, and increased risk of disseminated TB. These findings emphasize the importance of glycemic control in TB-DM patients and suggest the need for more aggressive screening and monitoring in this population.
Keywords
Diabetes mellitus
Extrapulmonary tuberculosis
Glycemic control
Hemoglobin A1C
Tuberculosis

INTRODUCTION
Tuberculosis (TB) remains a significant global health challenge, with India bearing approximately 28% of the world’s TB burden.[1] Recent systematic reviews and meta-analyses indicate that tuberculosis infection affects approximately 41% of the Indian population, making it a critical public health concern.[1] Simultaneously, India faces a rising epidemic of diabetes mellitus (DM), affecting approximately 10.5% of the global population and 8.3% of the Indian population.[2]
These two diseases represent a challenging dual epidemic that poses significant global health concerns. Recent epidemiological studies have highlighted the increasing convergence of these conditions, particularly in regions with high TB burden.[3-9] The relationship between TB and DM has gained renewed attention as global diabetes prevalence continues to rise, with current estimates suggesting that DM patients have a 2–3 times higher risk of developing TB compared to non-diabetic individuals.[4,10]
The interaction between TB and DM involves several interconnected pathophysiological mechanisms.[10,11] In patients with both conditions, diabetes significantly weakens the immune system by compromising macrophages and T-lymphocytes, particularly reducing T-helper 1 cells and crucial cytokines such as interleukin-1 and interleukin-6. This weakened immune response makes fighting TB infection more difficult and increases the risk of latent TB becoming active. Oxidative stress plays a central role in both diseases, with factors such as age, family history, and lifestyle choices in diabetic patients leading to increased stress levels. This results in the formation of advanced glycation end-products, which interact with immune cell receptors (receptor for advanced glycation end products [RAGE]) and affect TB infection response. The body’s cellular cleaning system, autophagy, which normally helps eliminate TB bacteria, becomes disrupted in both conditions. TB bacteria have evolved to prevent their destruction by interfering with autophagy-related genes, while diabetes-related conditions impair autophagy function through high blood sugar and oxidative stress. These alterations can result in atypical manifestations, increased disease severity, and potentially poorer treatment outcomes, a fact which has been validated by various research which has shown that clinical presentation of TB in diabetic patients often differs from classic patterns, along with variations in radiological findings, bacteriological characteristics, and extrapulmonary manifestations.[12-14]
Understanding these modifications is crucial for several reasons. First, it aids in early detection and appropriate management strategies. Second, it helps identify high-risk patients who may require more intensive monitoring. Finally, it contributes to developing targeted interventions that address both conditions simultaneously. This study aims to investigate the clinical spectrum of TB in patients with DM and analyze its relationship with glycemic status, focusing on both pulmonary and extrapulmonary manifestations.
MATERIALS AND METHODS
Study design and setting
A cross-sectional study was conducted between November 2023 and October 2024 at a tertiary care hospital. The study included 372 patients diagnosed with both TB and DM. The inclusion criteria encompassed patients aged ≥18 years with a confirmed diagnosis of TB (either bacteriologically or clinically), established diagnosis of DM, and consent to participate in the study. Patients were excluded if they were under 18 years old, had human immunodeficiency virus (HIV), were on steroids or any other form of immunosuppressive therapy, or were not willing for regular follow-up.
Data collection
Data collection involved the comprehensive gathering of demographic information, clinical features, and both laboratory and radiological investigations. Laboratory investigations included complete blood count, liver function tests, kidney function tests, sputum for acid-fast bacilli (AFB), HIV status, hemoglobin A1C (HbA1c), fasting blood sugar, postprandial blood sugar levels, and routine urine analysis. Additional tests such as fluid cytology, fine-needle aspiration cytology, biopsy, urine for AFB, chest X-ray, and ultrasonography of the abdomen were performed when necessary. Glycemic status assessment utilized HbA1c levels, categorized as good control (≤7%), moderate control (7.1– 9%), and poor control (>9%).[15]
Statistical analysis
Data analysis was performed using the Statistical Package for the Social Sciences version 25.0. The study employed both descriptive and inferential statistics. Categorical variables were presented as frequencies and percentages, while continuous variables were expressed as mean ± standard deviation. Statistical significance was determined using the Chi-square test and, Fisher’s exact test for categorical variables, and Student’s t-test for continuous variables, with P < 0.05 considered significant.
RESULTS
Demographic and clinical characteristics
The study population showed distinctive demographic patterns with a mean age of 44.3 ± 8.7 years and a notable male predominance (71.2% males vs. 28.8% females). The peak age group was 35–50 years, representing 52.4% of the participants. Regarding glycemic status, the mean HbA1c was 8.9 ± 2.3%, with patients distributed across three control categories: good control (23.9%), moderate control (38.2), and poor control (37.9%) [Table 1].
| Characteristic | Value |
|---|---|
| Total patients | 372 |
| Number of males (%) | 265 (71.2%) |
| Number of females (%) | 107 (28.8%) |
| Mean age (in years) | 44.3±8.7 |
| Mean HbA1c | 8.9±2.3 |
| Glycemic control distribution | |
| Good (HbA1c ≤7%) | 89 (23.9%) |
| Moderate (HbA1c: 7.1–9%) | 142 (38.2%) |
| Poor (HbA1c >9%) | 141 (37.9%) |
HbA1c: Hemoglobin A1C, ±: ± standard deviation
Clinical spectrum of TB
Pulmonary TB emerged as the dominant form, accounting for 65.3% of cases (243 patients). The distribution across glycemic control groups showed 27.9% in good control, 36.6% in moderate control, and 35.5% in poor control [Figure 1a]. Extrapulmonary TB comprised 34.7% of cases (129 patients), with a distinct distribution pattern across glycemic control groups: 16.3% in good control, 41% in moderate control, and 42.7% in poor control [Figure 1b].
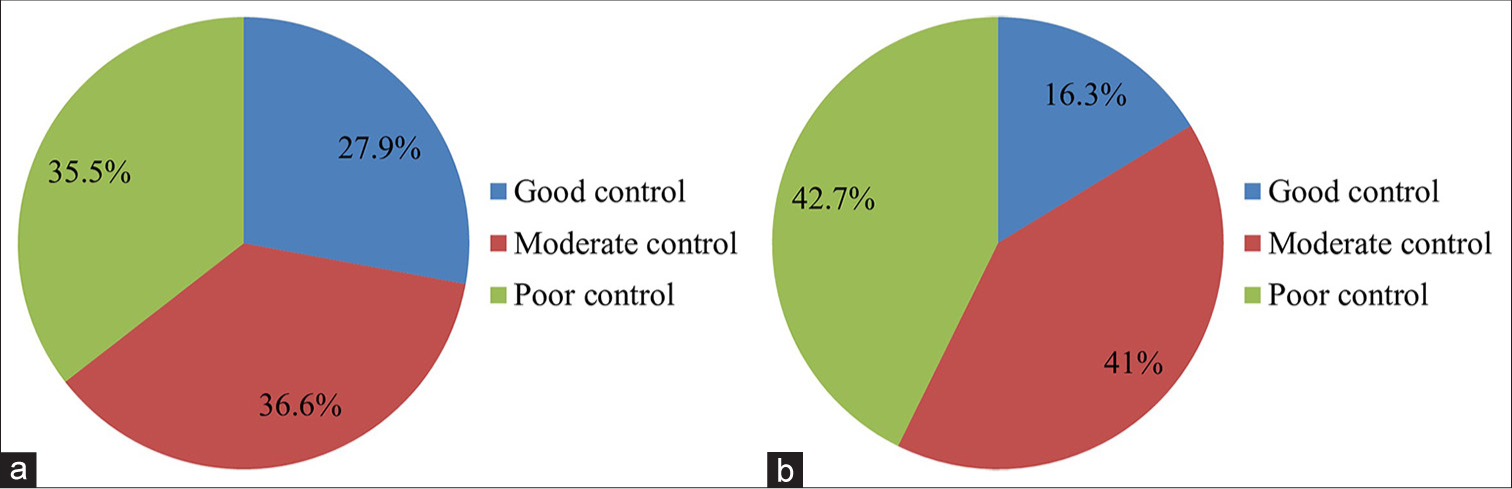
- (a) Distribution of pulmonary tuberculosis (TB) cases by glycemic control. (b) Distribution of extrapulmonary TB cases by glycemic control.
Relationship with glycemic status
Sputum positivity demonstrated a strong correlation with glycemic control [Figure 2]. The overall sputum positivity rate was 58.4%, with a clear progression across HbA1c levels: 42.3% positive in good control, 56.8% in moderate control, and 76.2% in poor control (P < 0.001).
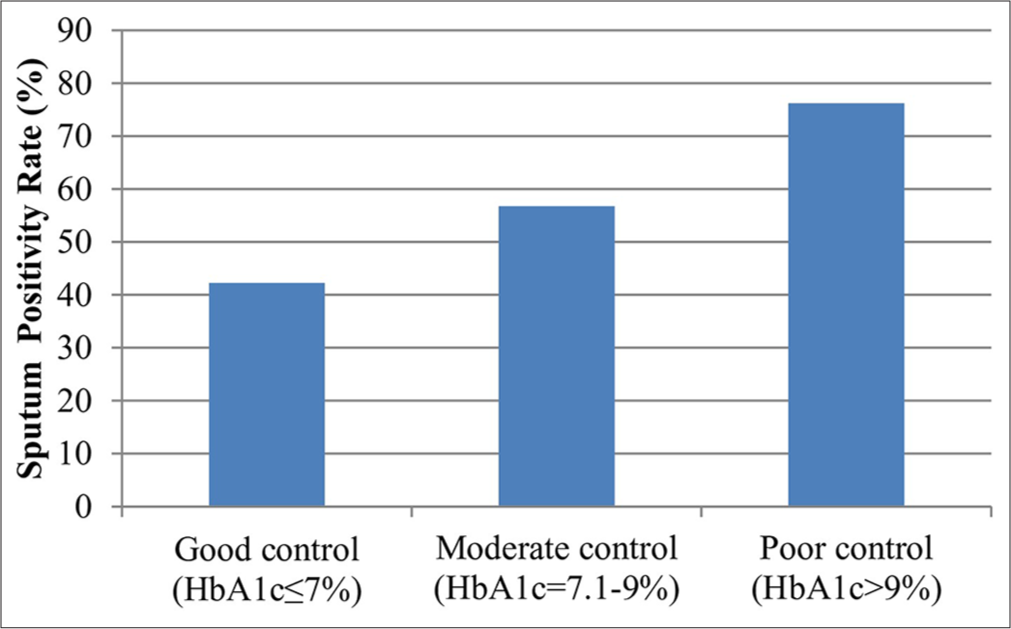
- Sputum positivity rates by glycemic control. HbA1c: Hemoglobin A1C
Among patients with poor glycemic control (HbA1c >9%), extrapulmonary manifestations showed a diverse pattern of involvement. Disseminated TB was most prevalent, affecting 45.5% of extrapulmonary cases, followed by lymph node TB (28.0%), pleural TB (21.3), central nervous system (CNS) TB (19.2%), and abdominal TB (19.1%). Less common manifestations included spine TB (4.4%), pericardial TB (2.7%), genitourinary TB (1.9%), and cutaneous TB (0.9%).
The pattern of extrapulmonary involvement varied significantly across glycemic control groups [Figure 3]. Patients with poor glycemic control showed the highest rate of disseminated TB (45.5%), significant lymph node involvement (28.0%), higher rates of CNS involvement (19.2%), and were more likely to have multiple site involvement. Those with moderate glycemic control exhibited intermediate rates of disseminated TB (30.2%), with a balanced distribution between pleural (22.6%) and lymph node (24.5%) involvement and moderate rates of abdominal involvement (17.0%). In contrast, patients with good glycemic control demonstrated the highest proportion of pleural TB (28.6%), lower rates of disseminated disease (19.0%), relatively stable lymph node involvement (23.8%), and were less likely to have multiple site involvement.
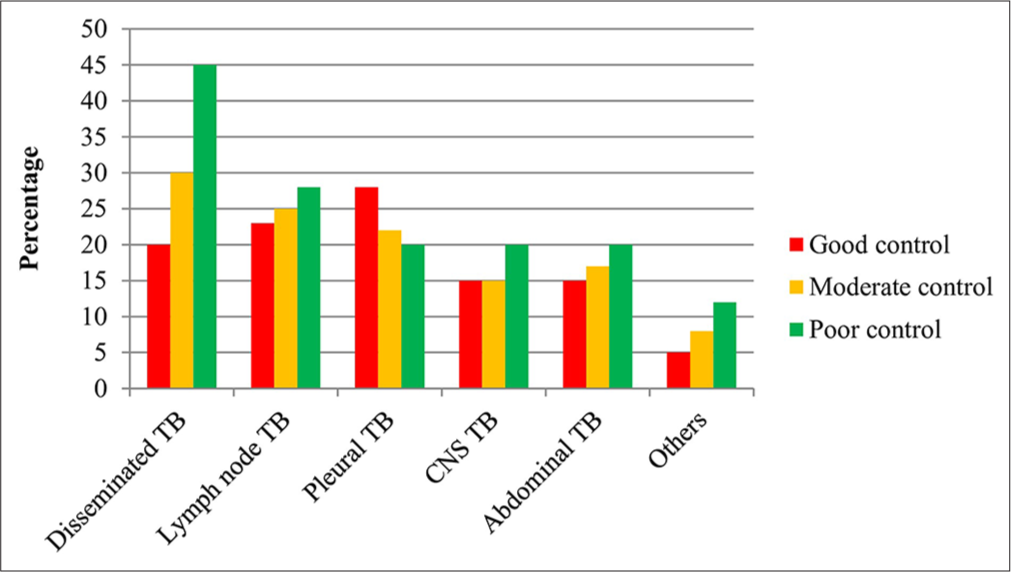
- Extrapulmonary tuberculosis distribution by glycemic control. Others include spine TB, pericardial TB, genitourinary TB, and cutaneous TB. TB: Tuberculosis, CNS: Central nervous system
Radiological findings
Chest X-ray patterns in pulmonary TB revealed interesting distributions in zone involvement, with lower zone involvement (64.8%) exceeding upper zone involvement (35.2%), and multiple zones affected in 42.3% of cases. Pattern distribution showed marked differences based on glycemic control [Table 2]. In poor control cases (HbA1c >9%), lower zone involvement was predominant (67.9%), bilateral involvement (58.4%), and higher cavity formation (45.3%). In contrast, good control cases showed upper zone predominance (52.1%), unilateral involvement (63.2%), and lower cavity formation (28.7%).
| Finding | Good control (HbA1c ≤7%) | Poor control (HbA1c >9%) |
|---|---|---|
| Zone involvement | Upper zone predominance (52.1%) | Lower zone predominance (67.9%) |
| Laterality | Unilateral (63.2%) | Bilateral (58.4%) |
| Cavity formation | 28.7% | 45.3% |
HbA1c: Hemoglobin A1C
DISCUSSION
This comprehensive study of 372 patients with concurrent TB and DM provides significant insights into the relationship between glycemic control and TB manifestations. The demographic profile revealed a male predominance (71.2%), consistent with previous studies.[3,13,14] The mean age of 44.3 years indicates that the disease primarily affects the economically productive age group.
The study demonstrated that pulmonary TB remains the predominant manifestation (65.3%) in diabetic patients, aligning with existing literature.[3,16] However, the pattern of involvement showed distinct characteristics in diabetic patients, particularly those with poor glycemic control.
A significant finding was the strong correlation between glycemic control and sputum positivity rates. Patients with poor glycemic control (HbA1c >9%) showed significantly higher sputum positivity (76.2%) compared to those with good control (42.3%), suggesting that poor glycemic control may enhance TB transmission risk due to longer sputum culture conversion time.[17,18] This marked difference in sputum positivity rates emphasizes the importance of glycemic control in managing TB transmission risk.
The radiological findings in our study revealed interesting patterns. Patients with poor glycemic control showed a higher prevalence of lower zone involvement (67.9%) and bilateral disease (58.4%), contrasting with the typical upper zone predominance seen in non-diabetic TB patients.[13,14,19] This atypical presentation might lead to diagnostic delays if not specifically considered during screening and assessment.
Particularly noteworthy was our finding regarding extrapulmonary manifestations, where patients with poor glycemic control (HbA1c >9%) demonstrated a high rate of disseminated TB (45.5%) and lymph node TB (28.0%). The progression of involvement across glycemic control groups was notable, with disseminated TB showing a clear correlation with worsening glycemic control. Patients with moderate control exhibited intermediate rates of dissemination (30.2%), while those with good control showed the lowest rates (19.0%). This pattern strongly suggests that poor glycemic control may facilitate mycobacterial dissemination,[10,11] possibly through impaired immune responses in hyperglycemic states.
The study also revealed that poor glycemic control was associated with more severe disease manifestations, including higher rates of cavity formation (45.3% vs. 28.7% in good control) and bilateral involvement. This observation supports the hypothesis that hyperglycemia may impair immune responses and lead to more severe disease presentations.[11,13] These findings emphasize the critical importance of maintaining optimal glycemic control in TBDM patients.
These results have important clinical implications. First, they suggest the need for more aggressive screening protocols in diabetic patients, particularly those with poor glycemic control. Second, they highlight the importance of maintaining optimal glucose levels as part of TB management. Finally, they indicate the need for heightened awareness of atypical presentations among healthcare providers, especially given the significant variation in disease patterns across different levels of glycemic control.
Limitations of the study
The study faced several limitations. First, the single-center study design may limit the generalizability of findings. Second, the cross-sectional nature of the study limits causal inference between glycemic control and TB manifestations. Finally, there may be potential referral bias due to the tertiary care setting of the study.
CONCLUSION
This study reveals compelling relationships between glycemic control and TB manifestations in diabetic patients. Our findings demonstrate that poor glycemic control correlates with increased sputum positivity, atypical radiological presentations (including predominant lower zone and bilateral involvement), and higher rates of disseminated and lymph node TB. These patterns have significant implications for clinical practice, emphasizing the critical importance of maintaining optimal blood glucose levels in TB-DM patients. Healthcare providers should implement more rigorous screening protocols, particularly for poorly controlled diabetic patients, and remain vigilant for atypical disease presentations. These insights could ultimately improve patient outcomes through early detection and targeted management strategies.
Author contributions
Dr Rahul Garg is responsible for concept, organization, execution, and manuscript writing. Dr Prashant provided review and critique.
Ethical approval
The research/study approved by the Institutional Review Board at F H Medical College, Agra, number FHMC/IEC/R. Cell/2023/39, dated 19th October 2023.
Declaration of patient consent
The authors certify that they have obtained all appropriate patient consent.
Conflicts of interest
There are no conflicts of interest.
Use of artificial intelligence (AI)-assisted technology for manuscript preparation
The authors confirm that there was no use of artificial intelligence (AI)-assisted technology for assisting in the writing or editing of the manuscript and no images were manipulated using AI.
Financial support and sponsorship: Nil.
References
- The prevalence of tuberculosis infection in India: A systematic review and meta-analysis. Indian J Med Res. 2023;157:135-51.
- [CrossRef] [PubMed] [Google Scholar]
- IDF Diabetes atlas. 2021. (10th ed). Brussels: International Diabetes Federation; Available from: https://diabetesatlas.org/ [Last accessed 2024 Dec 21]
- [Google Scholar]
- Clinical spectrum and medical comorbidities in tuberculosis: A hospital-based study in Northeast India. Cureus. 2020;12:e10580.
- [CrossRef] [Google Scholar]
- Tuberculosis and diabetes mellitus: Convergence of two epidemics. Lancet Infect Dis. 2009;9:737-46.
- [CrossRef] [PubMed] [Google Scholar]
- Tuberculosis and diabetes in southern Mexico. Diabetes Care. 2004;27:1584-90.
- [CrossRef] [PubMed] [Google Scholar]
- Glucocorticoid use, other associated factors, and the risk of tuberculosis. Arthritis Rheum. 2006;55:19-26.
- [CrossRef] [PubMed] [Google Scholar]
- Association between tuberculosis and diabetes in the Mexican border and non-border regions of Texas. Am J Trop Med Hyg. 2006;74:604-11.
- [CrossRef] [PubMed] [Google Scholar]
- An epidemiological evaluation of risk factors for tuberculosis in South India: A matched case control study. Int J Tuberc Lung Dis. 2006;10:80-6.
- [Google Scholar]
- Diabetic control and risk of tuberculosis: A cohort study. Am J Epidemiol. 2008;167:1486-94.
- [CrossRef] [PubMed] [Google Scholar]
- Tuberculosis-diabetes comorbidities: Mechanistic insights for clinical considerations and treatment challenges. World J Diabetes. 2024;15:853-66.
- [CrossRef] [PubMed] [Google Scholar]
- Diabetes mellitus and tuberculosis facts and controversies. J Diabetes Metab Disord. 2013;12:58.
- [CrossRef] [PubMed] [Google Scholar]
- Study of clinical and radiological profile of pulmonary tuberculosis among patients having diabetes mellitus. Int J Adv Med. 2017;4:1378-82.
- [CrossRef] [Google Scholar]
- Clinico-radiological profile and treatment outcome of pulmonary tuberculosis with and without type 2 diabetes mellitus. Indian J Tuberc. 2021;68:249-54.
- [CrossRef] [PubMed] [Google Scholar]
- A Cross sectional study on X-ray pattern of patients of pulmonary tuberculosis with diabetes mellitus in a tertiary care hospital in Tripura. J Med Sci Clin Res. 2018;6:1-7.
- [CrossRef] [Google Scholar]
- National diabetes statistics report. 2023. Atlanta, GA: Centers for Disease Control and Prevention; Available from: https://www.cdc.gov/diabetes/data/statistics-report/index.html [Last accessed 2024 Dec 02]
- [Google Scholar]
- Diabetes among tuberculosis patients and its impact on tuberculosis treatment in South Asia: A systematic review and meta-analysis. Sci Rep. 2021;11:2113.
- [CrossRef] [PubMed] [Google Scholar]
- Factors influencing sputum smear and culture conversion time among patients with new case pulmonary tuberculosis. Int J Clin Pract. 2007;61:231-5.
- [CrossRef] [PubMed] [Google Scholar]
- Mycobacterial clearance from sputum is delayed during the first phase of treatment in patients with diabetes. Am J Trop Med Hyg. 2008;79:541-4.
- [CrossRef] [Google Scholar]
- Radiologic features of pulmonary tuberculosis: An assessment of 188 cases. Can Assoc Radiol J. 1994;45:101.
- [Google Scholar]


