
Translate this page into:
Early evidence for inclusion of practice of morning ingestion of water as a lifestyle modification (adjuvant) in management of hypertension in patients of diabetes mellitus

*Corresponding author: Dr. Anavi Sheth, MBBS, Department of Medicine, Gujarat Medical Education and Research Society (GMERS) Medical College and Hospital Gotri, Vadodara, Gujarat, India. anavi1321@gmail.com
-
Received: ,
Accepted: ,
How to cite this article: Rathod C, Sheth A, Tailor P, Rana H, Godbole V, Shah A. Early evidence for inclusion of practice of morning ingestion of water as a lifestyle modification (adjuvant) in management of hypertension in patients of diabetes mellitus. Med India 2023;2:13.
Abstract
Objectives:
Researches reflecting the role of water in blood pressure (BP) regulation are documented to a lesser degree. A holistic approach, combining standard treatment protocols with lifestyle modifications, serves as the best approach to check the increasing prevalence and coexistence of hypertension (HTN) and diabetes mellitus. Thus, we aim to access the effects of morning ingestion of water on HTN in diabetic individuals when practiced adjuvant with antihypertensive and oral hypoglycemic medications.
Materials and Methods:
We conducted a prospective cohort with 68 patients having diabetes mellitus and HTN, with 34 participants each in the study and control group. The control group followed standard treatment protocol for HTN and diabetes mellitus. Study group in adjuvant to above practiced drinking 0.75–1 L of water altogether (within 5–10 min) in the morning immediately after waking up in a sitting (crossed leg or squatting) position. The changes in BP and other biochemical parameters were recorded.
Results:
For the study group (n = 34), repeated measured analysis of variance revealed a statistically significant lowering of systolic BP (SBP): F (2, 66) = 17.17, P ≤ 0.0001 and diastolic BP (DBP): F (2, 66) = 7.31, P = 0.0014. Moreover, post hoc analysis with Tukey–Kramer multiple comparisons found that the mean difference was statistically significant for baseline and end of 2 months – SBP: (14 [95% confidence interval, CI 8.23–19.77] mmHg, P < 0.001) and DBP: (6.35 (95% CI 2.22–10.48) mmHg, P < 0.01). The SBP and DBP at baseline versus the end of 2 months were 143.76 (13.40) versus 129.76 (14.27) mmHg and 84.35 (12.01) versus 78 (8.90) mmHg, respectively. In the study group, regression in the stage of HTN was observed where ten of 15 patients and 11 of 19 patients recovered from Stage I and Stage II HTN, respectively. Furthermore, 67.6% of the study group achieved a target BP of <140/90 mmHg at the end of 2 months.
Conclusion:
The practice of morning ingestion of water does affect BP regulation and this practice can be a new potential lifestyle modification adjuvant with standard treatment guidelines for management of HTN in patients of diabetes mellitus.
Keywords
Blood pressure regulation
Diabetes mellitus
Hypertension
Lifestyle modification
Morning ingestion of water
Non-pharmacological intervention

INTRODUCTION
Hypertension (HTN) is among the exclusively researched, documented, and discussed health condition globally. It has encroached health system by its increasing prevalence[1] both in developing as well as developed countries. At present, it accounts for 19% of the total deaths.[2]
The coexistence of HTN and diabetes is not an uncommon condition.[3] Nearly 40% of type I and 70% of type II diabetic patients are found to have blood pressure (BP) levels above 140/90 mmHg.[4] The pathological factors such as endothelial dysfunction, vascular inflammation, arterial remodeling, and dyslipidemia are shared in common by them besides, obesity, sedentary lifestyle, and increased consumption of carbohydrates and fats[5,6] which increase the risk of developing cardiovascular diseases. HTN optimum treatment study observed an almost 50% decline in cardiovascular events, when diastolic BP (DBP) lowered from 85 mmHg to 81 mmHg in diabetic but not in the non-diabetic subset.[7]
The current guidelines aim at a target BP of ≤140/90 mmHg in adults with both HTN and diabetes mellitus. The mainstay of treatment includes lifestyle modifications, dietary change, and antihypertensive drugs.[8] Multiple antihypertensive drugs are being prescribed, for it is almost impossible to achieve this goal with monotherapy.[9]
Water plays an essential role in regulating cellular homeostasis. Dehydration has been shown to elevate – blood viscosity, and hematocrit levels which act as independent risk factor for coronary heart diseases.[10] A recent study has shown a strong association between hypohydration and HTN.[11] At present, no markers exist to access the level of hydration at the population level.[12]
In India, the practice of morning ingestion of water is traditionally known as Usha Paana Chikitsha, which has been practiced by many Indians for ages to remain healthy. This concept has been mentioned in Rasayan Adhyaay of Ashtang Hruday in Aryuveda. It has been mentioned that it can be followed in a person who is devoid of any illness to remain healthy. One of the implications is that it helps in controlling BP, but this has not been previously investigated and so no scientific evidence exists about same.
Hence, our study aimed to find out whether there is any effect of the practice of morning ingestion of water on BP, and simultaneously, if this is practiced as a lifestyle modification (adjuvant) in patients of diabetes mellitus (that is with illness) can the management of HTN be improved in them or not. Moreover, if yes what can be the possible mechanism behind it?
MATERIALS AND METHODS
Research was carried out at GMERS Medical College and Hospital Gotri, Vadodara, Gujarat India; under the Department of Medicine; between July and October 2018, after obtaining permission from the Institutional Human Ethics Committee. The study was conducted on an outpatient department (OPD) basis. Participants were enrolled after obtaining written informed consent and they had rights to withdraw from the study. All the details of the participants were kept confidential.
68 participants were enrolled on the following inclusion and exclusion criteria:-
Inclusion criteria
Participants with Stage-I/Stage-II HTN (according to Joint National Committee [JNC] VIII guidelines), on stable antihypertensive and oral hypoglycemic medications for 4 weeks, with willingness to participate in the study were selected.
Exclusion criteria
Participants with – ischemic heart disease, heart failure, end organ damage, diabetic neuropathy, nephropathy, retinopathy, liver diseases, renal disease, and failure were not included in the study.
Objectives
The objectives of this study were to observe changes in systolic BP (SBP), DBP, fasting blood sugar (FBS), glycosylated hemoglobin, serum osmolality, serum cholesterol, and serum electrolytes.
Study procedure
For this study, 1000 patients were screened, out of which 110 were found eligible for the research. Ninety-three participants gave consent for the research and 68 participants finally managed to complete the follow-ups. There was no loss to follow-up.
The 68 participants were randomly and equally distributed into the study and control group, with equal gender representation in each group. The physical activity score was recorded using the Global Physical Activity Questionnaire[13] and was similar for both groups.
BP was measured using a standard calibrated mercuric sphygmomanometer in a sitting position with arms supported at heart level. The participants were given adequate rest of 10 min before measuring BP. During the screening period, the BP in both arms was checked and participants with BP difference of <10 mmHg were included in the study; following which the BP was recorded in the right upper limb throughout the study. The BP at first was recorded by palpatory method to know the approximate SBP at the right radial artery, to prevent the auscultatory gap. This was then followed by the auscultatory method in which the cuff was reinflated to 20 mmHg more than recorded by the palpation method and SBP and DBP were recorded in the right brachial artery of participants. The BP in each setting was recorded thrice at interval of 5 min and the average value was then taken into consideration. This BP monitoring was done at an interval of 1 month for a duration of 2 months and biochemical investigations were done at the start of the study and at the end of 2 months, for both the study and control group.
The control group followed standard treatment of diabetes mellitus and HTN. Study group in addition to the above practiced morning ingestion of water in which individuals were asked to drink 3–4 glasses (0.75–1 L) of water altogether(within 5–10 min) in the morning immediately after waking up, in a sitting (crossed leg or squatting) position. The water intake (in the study group) is in addition to the overall daily water intake by them. Few participants reported experiencing nausea and vomiting after drinking 3-4 glasses of water, these patients were asked to drink 1-2 glasses of water instead.
Statistics
Sample size
Calculated sample size-82, keeping Type-1 error α at 0.05, the power of study β at 0.8, clinically significant difference at 5 mmHg, and standard deviation of variable BP measured in mmHg at 8, the calculated sample size was 41 participants in the study and control group each. This was done using PS2 software.[14]
Statistical analysis
Data analysis was done using microsoft excel sheet and graphpad instat 3 demo version. The comparision between study and control group was done by unpaired t-test. And within the group comparison were done by paired t-test forBP, biochemical parameters and hematocrit. BP analysis was done by repeated measured analysis of variance (ANOVA). For categorical data chisquare test was used. P < 0.05 was considered significant.
Data notation: n- no. of participants.
RESULTS
Sixty eight participants took part in the study, with the mean age of 54.06 (6.83) and 56.088 (5.151) in control and study group, respectively. There was no significant difference in baseline SBP and DBP between both the groups [Table 1]. For the study group: Repeated measured ANOVA (n = 34) revealed a statistical significant lowering of SBP, F (2, 66) = 17.17, P ≤ 0.0001. Post hoc analysis with Tukey–Kramer multiple comparison test found that the mean SBP difference was statistically insignificant for baseline and end of 1 month (E1M) (5.65 [95% confidence interval, CI −0.12 to 11.42] mmHg, P > 0.05) and statistically significant for E1M to end of 2 months (E2M) (8.34 [95% CI 2.58–14.12] mmHg, P < 0.01) and baseline to E2M (14 [95% CI 8.23–19.77] mmHg, P < 0.001) [Figure 1]. Moreover, repeated measured ANOVA for DBP revealed a statistical significant lowering of DBP, F (2, 66) = 7.31, P = 0.0014. Post hoc analysis with above-mentioned test found that mean DBP difference was statistically insignificant for baseline and E1M (1.71 [95% CI −2.42–5.86] mmHg, P > 0.05) and statistically significant for E1M to E2M (4.65 [95% CI 0.51–8.78] mmHg, P < 0.05) and baseline to E2M (6.35 (95% CI 2.22–10.48) mmHg, P < 0.01) [Figure 2].
| Variable | Control group | Study group | P-value |
|---|---|---|---|
| Age (in year) | 54.06±6.83 | 56.09±8.15 | 0.27 |
| Gender | |||
| Male | 12 (18%) | 12 (18%) | 1.0* |
| Female | 22 (32%) | 22 (32%) | |
| SBP (in mmHg) | 140.29±12.94 | 143.77±13.4 | 0.281 |
| DBP (in mmHg) | 85.71±8.8 | 84.35±12 | 0.6 |
SBP: Systolic blood pressure, DBP: Diastolic blood pressure. Categorical data presented as number (%) and continuous data as mean±standard deviation. P-value by Chi-square test* or unpaired t-test. All data at 95% confidence interval
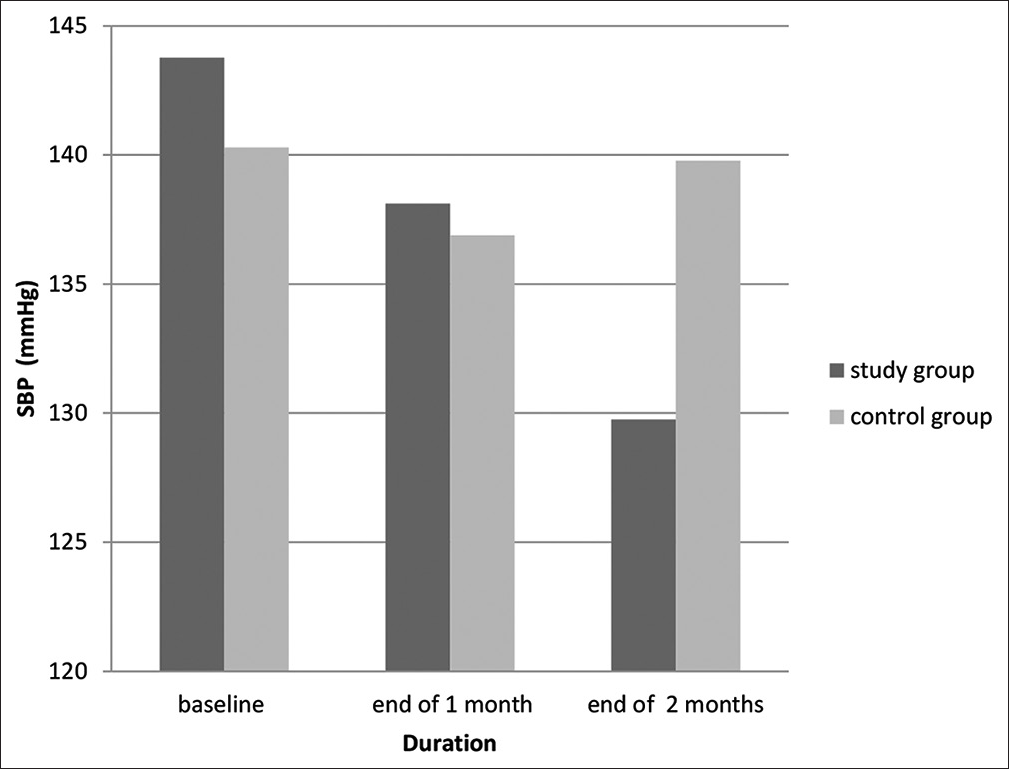
- Graph compares the changes in Systolic blood pressure (SBP) between the study and control group.3

- Graph compares the changes in Diastolic blood pressure (DBP) between the study and control group.4
For the control group. Repeated measured ANOVA (n = 34) showed a statistically insignificant difference between mean SBP [Figure 1] and DBP [Figure 2] of baseline, E1M and E2M: F (2, 66) = 1.38, P = 0.26 and F (2, 66) = 2.79, P = 0.69, respectively.
In the study group at the beginning, there were 15 patients in Stage-I and 19 patients in Stage-II of HTN. By E2M, 11 patients recovered from Stage-II (six had BP within the range of Stage-I, three had in a range of elevated BP (EBP) level, and two had BP within the normal range). For those who were initially in Stage-I HTN, four had BP in range of EBP and six had in normal range at E2M. The rest of the study group (n = 11) who remained within the same stage of HTN showed a significant decrease in both SBP=149.45 (13.5) to 142.54 (10.2); P-value (paired t-test) 0.0017 at 95% CI and DBP=86.4 (11.2) to 78.4 (11.6); P-value (paired t-test) 0.026 at 95% CI. In the study group, 67.6% had a target BP of <140/90 mmHg, as suggested in the JNC VIII guidelines. For reasons unknown, two patients did show an elevation in BP.
For the control group, at the beginning, there were 16 in Stage-I and 18 in Stage-II HTN. Four patients in the control group showed a reduction from stage-I to EBP levels and two patients showed Stage-II to Stage-I conversion. However, seven patients depicted elevation in BP with a change from Stage-I to Stage-II HTN. Control group patients in whom stage of HTN remained unchanged did not show any significant change in SBP=144.6 (13.5) to 144.2 (13.5); P-value (paired t-test) 0.91, at 95% CI and DBP=86.72 (10.36) to 85.27 (8.01); P-value (paired t-test) 0.56 at 95% CI.
A significant decrease in SBP can be observed for both genders in study group. And a similar decrease in DBP in male study group. Females in study group have shown decrease in DBP but result isn’t significant [Table 2].
| Category | Female | Male | ||
|---|---|---|---|---|
| Control group | Study group | Control group | Study group | |
| Baseline | ||||
| SBP | 136.36 (9.54) | 144.54 (13.97) | 147.5 (15.52) | 142.33 (12.76) |
| DBP | 84 (6.98) | 82.63 (11.85) | 88.83 (11.07) | 87.5 (12.15) |
| At E1M | ||||
| SBP | 136.54 (14) | 139.54 (17.68) | 137.5 (19.88) | 135.5 (19.11) |
| DBP | 82.55 (8.56) | 82.54 (10.15) | 80.67 (11.07) | 82.83 (9.28) |
| At E2M | ||||
| SBP | 138.90 (13.31) | 131.54 (15.31) | 141.33 (13.47) | 126.5 (12.06) |
| DBP | 84.55 (6.6) | 79.54 (8.16) | 84.5 (9.84) | 75.17 (9.85) |
| P-value (between baseline and end of 2 months) | ||||
| SBP | 0.232 | 0.0007* | 0.214 | 0.0002* |
| DBP | 0.697 | 0.17 | 0.342 | 0.0073* |
SBP: Systolic blood pressure, DBP: Diastolic blood pressure, E1M: End of 1 month E2M: End of 2 months. Continuous data presented as mean (standard deviation). (*) indicates P<0.05: Statistically significant. All data at 95% confidence interval. P value by paired t-test1
DISCUSSION
To the best of our knowledge, we are among the first to study the effects of morning ingestion of water on HTN, adjuvant with standard treatment protocols. Few studies that have demonstrated the effect of water intake on BP, were done for short period of time. And in a normal individual or in patients with autonomic failure.
A handful of researches that can help to understand, explain, and support the findings of our research have been mentioned below as no similar studies have been conducted before.
Madhavulu et al.[15] studied the immediate effects of water ingestion on BP. Their study noted an increase in both SBP and DBP with a significant fall in serum osmolality after ingestion of 2000 mL of water. Our study was conducted for 2 months duration and we noted a gradual and sustained fall in both SBP and DBP. Alongside a decrease in FBS [Figure 3], a minute fall in serum osmolality, and serum sodium [Table 3] was also observed within the study group. These differences in both studies are attributed to the amount of water consumed, the time interval between the sample collection and the duration of both the studies.

- Graph compares the change in fasting blood sugar (FBS) between study and control group.5
| Variables | Control group (P-value) | Study group (P-value) | ||
|---|---|---|---|---|
| Serum cholesterol (mmol/L) | ||||
| Baseline | 4.41 (1.45) | 0.266 | 4.49 (1.12) | 0.687 |
| E2M | 4.61 (1.56) | 4.56 (0.99) | ||
| Serum creatinine (micromol/L) | ||||
| Baseline | 88.16 (29.24) | 0.563 | 79.32 (16.65) | 0.417 |
| E2M | 89.20 (29.88) | 77.24 (15.59) | ||
| Serum sodium (mmol/L) | ||||
| Baseline | 134.56 (3.4) | 0.001 | 136.94 (2.65) | 0.055 |
| E2M | 135.82 (2.75) | 135.88 (2.83) | ||
| Serum potassium (mmol/L) | ||||
| Baseline | 4.58 (0.43) | 0.243 | 4.42 (0.44) | 0.171 |
| E2M | 4.68 (0.58) | 4.52 (0.5) | ||
| Serum chloride (mmol/L) | ||||
| Baseline | 103.77 (4.03) | 0.225 | 103 (2.62) | 0.344 |
| E2M | 104.5 (3.17) | 103.56 (2.97) | ||
| HBA1C (%) | ||||
| Baseline | 7.66 (1.76) | 0.957 | 7.705 (1.92) | 0.316 |
| E2M | 7.65 (1.87) | 7.56 (1.898) | ||
| Serum osmolality (mmol/kg) | ||||
| Baseline | 286.46 (6.71) | 0.587 | 289.53 (5.97) | 0.055 |
| E2M | 286.93 (7.2) | 287.7 (5.37) | ||
| Hematocrit (%) | ||||
| Baseline | 34.98 (4.74) | 0.28 | 37.53 (3.01) | 0.021 |
| E2M | 34.7 (4.85) | 36.64 (3.14) | ||
E2M: End of 2 months, HBA1C: Glycosylated hemoglobin. Continuous data represented as mean (standard deviation). (*) indicates P < 0.05 statistically significant. All data at 95% confidence interval. P value by paired t-test2
A study has shown that 1 week of hyperhydration in soccer players resulted in an increase in total body water in spite of increased urine output along with a minor fall in hematocrit that may be due to hemodilution.[16] In our study, the intake of water in the study group is evident from the changes of hematocrit, serum sodium, and osmolality [Table 3]. The slight but significant fall in hematocrit along with a near significant fall of serum sodium and serum osmolality suggests that water intake results in minor degree of plasma volume expansion. Although 24 h urine output is a better indicator for knowing the overall increase in water intake but on an OPD basis, it was not feasible to be conducted. The fall noted in the above parameters would have been more if the blood sample was collected immediately after 30–60 min of water intake.[15] Hence, the changes observed in parameters might be resultant of a steady state that developed over 2 months.
One crucial finding was a statistically significant fall in DBP in the male study group [Table 2] from 87.5 mmHg to 75 mmHg at end of 2 months from baseline and a similar trend was found in the female study group as well, though it was statistically insignificant; which suggest that there is lowering of peripheral vascular resistance.
Researchers have shown the presence of glycosuria even under euglycemic conditions, declining the concept of a universal glucose threshold.[17] No significant change in urine glucose level was found in our study, which could be due to tests that are routinely practiced are less sensitive to detect such minor changes.
How elevated blood glucose, blood viscosity, and insulin resistance influence BP? [Algorithm 1]

- Hypothesized mechanism for control of blood pressure by practice of morning ingestion of water.
In a study by Lowe et al.,[18] elevated blood sugar level has been linked with raised blood viscosity. Increase blood glucose levels cause a decrease in deformability and an increase in aggregation of red blood cells (RBCs), raising the systolic and diastolic blood viscosity, respectively.
Elevated viscosity increases the workload of heart and results in vascular inflammation.[19] This may contribute to the initiation of cardiovascular diseases in both diabetic and hypertensive patients
Increase viscosity also results in a decrease in blood flow rate,[20] which causes insulin resistance at tissues that were sensitive to insulin thereby, contributing to hyperglycemia[21]
The body physiologically compensates for elevated viscosity by either increasing BP or by vasodilation;[22] with atherosclerotic vessels comparatively less vasodilation is observed.[23]
Insulin causes vasodilation by endothelial nitric oxide synthase production. Elevated blood glucose hampers the production of nitric oxide and facilitates production of hormones causing vasoconstriction which cannot be vanquished by high levels of insulin.[24] Furthermore, diminished vasodilation is seen during state of insulin resistance.
Presence of insulin resistance leads to HTN and vice versa.[25] Hyperosmolality also contributes to insulin resistance.[26] Thus, hyperosmolality is an indirect participating factor to increased BP.
In addition, obesity which is itself a risk factor for insulin resistance also contributes to Increased BP by central activation of sympathetic nervous system.[27]
The concept as to “how drinking water in morning is different from water intake throughout the day?” can be explained on the following basis:
Drinking water in the morning when the stomach is empty facilitates better and faster absorption of water from the proximal intestine due to increased gastric emptying. This can be explained on the basis of the study done by Leiper,[28] in which the rate of gastric emptying was found directly proportional to the volume of water intake and inversely related to the energy density of fluid.
The second reason deals with the excretion part of water. The study by Shafiee et al.[29] found that when a fixed amount of water is consumed in a brief duration (minutes) it’s mainly excreted, whereas if the same taken over length of period (hours) it’s retained.
Therefore, in the morning when water (non-caloric drink) is ingested (0.75–1 L) within 5–10 min, the majority of the water will be excreted after the maximum possible level of dehydration is corrected.
A decrease in fluid intake becomes an important factor in old age. Mack et al.[30] found that, with aging, there is a decrease in thirst. Even though the elderly have higher osmolality than younger individuals,[31] they tend to drink less fluid to compensate for their fluid need.[32]
Anastasio et al.,[33] in a short-term study, found that in the fasting state, high hydration decreases glomerular filtration rate (GFR) and increases natriuresis. Two independent studies on dogs by Higgins and Meinders[34] and Kurtzman et al.[35] have shown that with a decrease in GFR and extracellular fluid expansion, there is natriuresis and decreased glucose reabsorption.
The initial sudden increase in water content within the intravascular space will facilitate and improve peripheral circulation. And simultaneously, it will also help in glucose excretion through the kidney. As the circulation will improve, the insulin will reach the peripheral tissues, causing better glucose uptake by the same. As blood glucose will improve, it would cause a decrease in blood viscosity by preventing RBC aggregation. The natriuresis and glucose excretion will facilitate the lowering of both systolic and DBP, with a mild-moderate fall in blood sugar levels
Therefore, morning ingestion of water will ensure effective water absorption from the intestine, correct dehydration, help in lowering plasma osmolality, and facilitate sodium and glucose excretion and in patients with normal kidney function, the water will also be excreted thereby preventing water intoxication.
The chances are likely that there are other mechanisms by which morning ingestion of water causes a reduction in BP. A long-term study is required to know its effect on cardiovascular pathophysiology, taking into account kidney function, hormonal analysis, BP homeostasis, blood sugar regulation, and blood viscosity.
This is a lifestyle modification where we are ensuring that the daily requirement of water intake is met along with improving BP control; as this water intake is in addition to the regular intake by the person; without causing water intoxication.
With obvious reasons that this cannot be practiced in patients in whom volume overload is cautioned to prevent further progression and worsening of diseases such as congestive cardiac failure, renal failure, and diseases causing pulmonary edema.
Why research has been done in patients with HTN and diabetes mellitus (DM) rather than isolated HTN?
The very concept of the response of HTN to water through fluid expansion is based on the pathophysiology hypothesized in references 18–24, which explains that hyperglycemia leads to a decrease in RBC deformability and increases its aggregation. The increased viscosity causes an increase in the workload of the heart and also results in vascular inflammation. Hence, we focused on enrolling diabetic patients with HTN who were on stable medication for 4 weeks and yet having BP above the desired level, thereby applying the practice of morning ingestion of water as adjuvant.
In cases of isolated HTN, if raised BP is resultant of the abovementioned pathophysiology; then yes a decrease in BP may be noted in a similar way. The practice of morning ingestion of water may have a potential effect on multiple sites of the pathophysiology of HTN like blood circulation, blood vessel compliance, Renin-angiotensin aldosterone system (RAAS), vascular inflammation, and autonomic nervous system. And thus, this remains a potential area of research for the future, as the most common cause of HTN is idiopathic.
The practice of morning ingestion of water may play a prophylactic role in preventing the development of HTN in diabetic patients and normal population.
This research brings a completely new insight into understanding the role of water intake (adequate hydration) in the regulation of BP by the practice of morning ingestion of water. To the best of our knowledge, previously no such study has been known to be conducted. Moreover, this new lifestyle modification will bring better outcomes in the management of HTN and cardiovascular diseases.
Limitations of our study
We do understand that we have not met our target sample size of 82 participants, but we have tried to achieve the best possible sample size in the defined time period, where the minimum duration required for therapy to reflect changes in BP was 2 months along with a proper follow-up. And now, hopefully, for the next study, based on encouraging results and patient compliance, we shall do it for a larger sample size.
CONCLUSION
The practice of morning ingestion of water does affect BP regulation and this practice can be a new potential lifestyle modification adjuvant with standard treatment guidelines for management of HTN in patients of diabetes mellitus.
Acknowledgment
We express our deep gratitude to ICMR for their STS initiative, where we sculptured our idea into reality. We would like to thank our institute for providing us with opportunities to carry out the research. We thank our parents and grandparents for their encouragement and support. We extend our gratitude to Dr. Tejas Patel and Dr. Anand Patel for their constructive recommendations.
We thank AMINS Pathology Referral Laboratory and IPCA Laboratories Limited for their input in laboratory investigations.
Author Contributiions
Dr. Chirag Rathod: Guarantor, Study Design, Critical review, Final approval, Dr. Anavi Sheth: Guarantor, Conception, Study design, Data analysis and interpretation, Draft article, Dr. Poorva Tailor: Conception, Data collection, Draft article, Dr. Himanshu Rana: Critical review, Final approval, Dr. Varsha Godbole: Critical review, Dr. Ashka Shah: Data collection, Draft article.
Declaration of patient consent
The authors certify that they have obtained all appropriate patient consent.
Conflicts of interest
There are no conflicts of interest.
Financial support and sponsorship
Nil.
Footnote
References
- Global burden of hypertension and systolic blood pressure of at least 110 to 115 mm Hg, 1990-2015. JAMA. 2017;317:165-82.
- [CrossRef] [PubMed] [Google Scholar]
- Global, regional, and national comparative risk assessment of 79 behavioural, environmental and occupational, and metabolic risks or clusters of risks 1990-2015: A systematic analysis for the Global Burden of Disease Study 2015. Lancet. 2016;388:1659-724.
- [CrossRef] [PubMed] [Google Scholar]
- Prevalence of arterial hypertension in diabetic patients before and after the JNC-V. Diabetic Care. 1994;17:1247-51.
- [CrossRef] [PubMed] [Google Scholar]
- Case study: The link between hypertension and diabetes. J Manag Care Pharm. 2007;135(Suppl):S17-9.
- [CrossRef] [PubMed] [Google Scholar]
- High prevalence and low awareness of hypertension in a market population in Enugu, Nigeria. Int J Hypertens. 2011;2011:869675.
- [CrossRef] [PubMed] [Google Scholar]
- Effects of intensive blood-pressure lowering and low-dose aspirin in patients with hypertension: Principal results of the Hypertension Optimal Treatment (HOT) randomised trial. HOT Study Group. Lancet. 1998;351:1755-62.
- [CrossRef] [PubMed] [Google Scholar]
- 2014 evidence-based guideline for the management of high blood pressure in adults: Report from the panel members appointed to the eighth Joint National Committee (JNC 8) JAMA. 2014;311:507-20.
- [CrossRef] [PubMed] [Google Scholar]
- Preserving renal function in adults with hypertension and diabetes: A consensus approach. National Kidney Foundation Hypertension and Diabetes Executive Committees Working Group. Am J Kidney Dis. 2000;36:646-61.
- [CrossRef] [PubMed] [Google Scholar]
- Water, other fluids, and fatal coronary heart disease. The Adventist Health Study. Am J Epidemiol. 2002;155:827-33.
- [CrossRef] [PubMed] [Google Scholar]
- Assessment of hydration status and blood pressure in a tertiary care hospital at Al-Khobar. Cureus. 2022;14:e27706.
- [CrossRef] [PubMed] [Google Scholar]
- High prevelance of plasma hypertonicity among community-dwelling older adults: Results from NHANES III. J Am Diet Assoc. 2005;105:1231-9.
- [CrossRef] [PubMed] [Google Scholar]
- Available from: https://www.who.int/ncds/surveillance/steps/resources/gpaq_analysis_guide.pdf [Last accessed on 2018 Jan 05]
- PS: Power and Sample Size Calculation Version 3.1.2. 2014. Available from: https://biostat.mc.vanderbilt.edu/wiki/main/powersamplesize [Last accessed on 2018 Jan 19]
- [Google Scholar]
- Acute effect of excess water intake on blood pressure in healthy individuals. Asian Pac J Health Sci. 2014;1:496-9.
- [CrossRef] [Google Scholar]
- Effects of hyperhydration on total body water, temperature regulation and performance of elite young soccer players in a warm climate. Int J Sports Med. 1996;17:85-91.
- [CrossRef] [PubMed] [Google Scholar]
- Renal glucose excretion and tubular reabsorption rate related to blood glucose in subjects with Type 2 diabetes with a critical reappraisal of the “renal glucose threshold” model. Horm Metab Res. 2009;41:600-4.
- [CrossRef] [PubMed] [Google Scholar]
- Blood viscosity in young male diabetics with and without retinopathy. Diabetologia. 1980;18:359-63.
- [CrossRef] [PubMed] [Google Scholar]
- Comparative evaluation of blood viscosity in diabetic retinopathy. Int Ophthalmol. 1984;7:15-9.
- [CrossRef] [PubMed] [Google Scholar]
- Role of blood flow in the regulation of muscle glucose uptake. Annu Rev Nutr. 1997;17:487-99.
- [CrossRef] [PubMed] [Google Scholar]
- Effect of hematocrit on blood pressure via hyperviscosity. Am J Hematol. 1999;12:739-43.
- [CrossRef] [PubMed] [Google Scholar]
- Analysis of coronary responses to various doses of intracoronary nitroglycerine. Circulation. 1982;66:321-7.
- [CrossRef] [PubMed] [Google Scholar]
- The effects of plasma insulin and glucose on myocardial blood flow in patients with Type 1 diabetes mellitus. J Am Coll Cardiol. 2005;46:42-8.
- [CrossRef] [PubMed] [Google Scholar]
- The interrelationship between insulin resistance and hypertension. Drugs. 1993;46(Suppl 2):149-59.
- [CrossRef] [PubMed] [Google Scholar]
- Impairment of insulin-mediated glucose metabolism by hyperosmolality in man. Diabetes. 1983;32:1028-34.
- [CrossRef] [PubMed] [Google Scholar]
- Sympathetic nervous system in obesity-related hypertension: Mechanisms and clinical implications. Hypertens Res. 2012;35:4-16.
- [CrossRef] [PubMed] [Google Scholar]
- Intestinal water absorption--implications for the formulation of rehydration solutions. Int J Sports Med. 1998;19(Suppl 2):S129-32.
- [CrossRef] [PubMed] [Google Scholar]
- Defining conditions that lead to the retention of water: The importance of the arterial sodium concentration. Kidney Int. 2005;67:613-21.
- [CrossRef] [PubMed] [Google Scholar]
- Body fluid balance in dehydrated healthy older men: Thirst and renal osmoregulation. J Appl Physiol (1985). 1994;76:1615-23.
- [CrossRef] [PubMed] [Google Scholar]
- Age-associated alterations in thirst and arginine vasopressin in response to a water or sodium load. Age Ageing. 1995;24:151-9.
- [CrossRef] [PubMed] [Google Scholar]
- Reduced thirst after water deprivation in healthy elderly men. N Engl J Med. 1984;311:753-9.
- [CrossRef] [PubMed] [Google Scholar]
- Level of hydration and renal function in healthy humans. Kidney Int. 2001;60:748-56.
- [CrossRef] [PubMed] [Google Scholar]
- Quantitative relationship of renal glucose and sodium reabsorption during ECF expansion. Am J Physiol. 1975;229:66-71.
- [CrossRef] [PubMed] [Google Scholar]
- Relationship of sodium reabsorption and glomerular filtration rate to renal glucose reabsorption. J Clin Invest. 1972;51:127-33.
- [CrossRef] [PubMed] [Google Scholar]


